Adventures with Victory and Canvas
 Becca Bailey
When it comes to building charts in React, Victory does a lot of work for you. It handles scaling, positioning, rendering, and animations, all while providing a lot of options for customization. It’s easy to get started with Victory by importing a few components and passing in an array of data. From there, Victory is able to traverse your data components in order to determine the type and extent of your data.
Victory’s ability to make inferences about your data based on its child components and provide intelligent fallbacks is one of its superpowers. However, there are some tradeoffs to this behavior, mainly when it comes to performance.
In Part 1, I wrote about some of the general principles for improving the performance of large data visualizations, including rendering less data, reducing re-paints, and using an alternative rendering API like Canvas. In addition to researching general strategies for high-performance data visualizations, one of my goals in the fellowship I completed was to find some ways to better use these strategies in Victory.
In this post, I will focus on how we can use the Canvas API to create custom data visualization components that can be used with Victory or as standalone visualizations.
What is the Canvas API?
Canvas is a pixel-based drawing API. We can use Canvas by rendering a canvas HTML element in the DOM and using a series of JavaScript commands to get the canvas context and draw shapes inside the canvas container. In React, that process looks something like this.
function Chart() {
  const canvasRef = React.useRef();

  React.useEffect(() => {
    const ctx = canvasRef.current.getContext("2d");
    // Draw something
  });

  return <canvas ref={canvasRef} height={100} width={200} />;
}
Canvas excels at high-performance data visualizations in the browser. If we are building a chart with many data points, an SVG chart would need to render each data point as a DOM node, while Canvas can use a single wrapper. Check out my first post for an in-depth performance comparison.
Many of us may be familiar with Canvas as a predecessor to SVG, and there are some trade-offs around appearance and developer experience to be aware of.
Pixelation
As a vector-based graphic syntax, one of the great advantages of SVG is the ability to look sharp at any zoom level or screen size. An SVG can be scaled up or down without resolution ever being a concern. This is not the case with Canvas, and I found it helpful to scale up the canvas container for larger views and high-resolution screens in order to avoid pixelation.

Zoomed-in view of a Canvas chart
Targeting individual elements
Another advantage of SVG is the ability to target individual DOM elements. This makes it easier to mount or unmount an individual shape, or move an element from one location to another while keeping its surroundings the same. In order to update a Canvas shape, we either need to “draw over” the existing shape or erase and re-draw the entire canvas. I found this canvas layering technique to be helpful for isolating elements that need to be re-drawn together.
In this example, there is a separate canvas container for the moving cursor line and points so the lines do not need to be re-drawn when the points re-render.

Building a chart with Canvas
Let’s start by using some Canvas functions to build a basic line chart. This will draw a path with a straight line between each of the points.
function Line({ lineWidth, color, data, height, width }) {
  const canvasRef = React.useRef();

  const draw = React.useCallback(
    (ctx, data) => {
      const [first, ...rest] = data;
      ctx.strokeStyle = color;
      ctx.lineWidth = lineWidth;
      ctx.beginPath();
      ctx.moveTo(first.x, first.y);
      if (rest.length) {
        rest.forEach(({ x, y }) => {
          ctx.lineTo(x, y);
        });
        ctx.stroke();
      }
    },
    [lineWidth, color]
  );

  React.useEffect(() => {
    const ctx = canvasRef.current.getContext("2d");
    draw(ctx, data);
  }, [])

  return (
    <canvas
      style={{ width: "100%" }}
      ref={canvasRef}
      height={height}
      width={width}
    />
  );
}
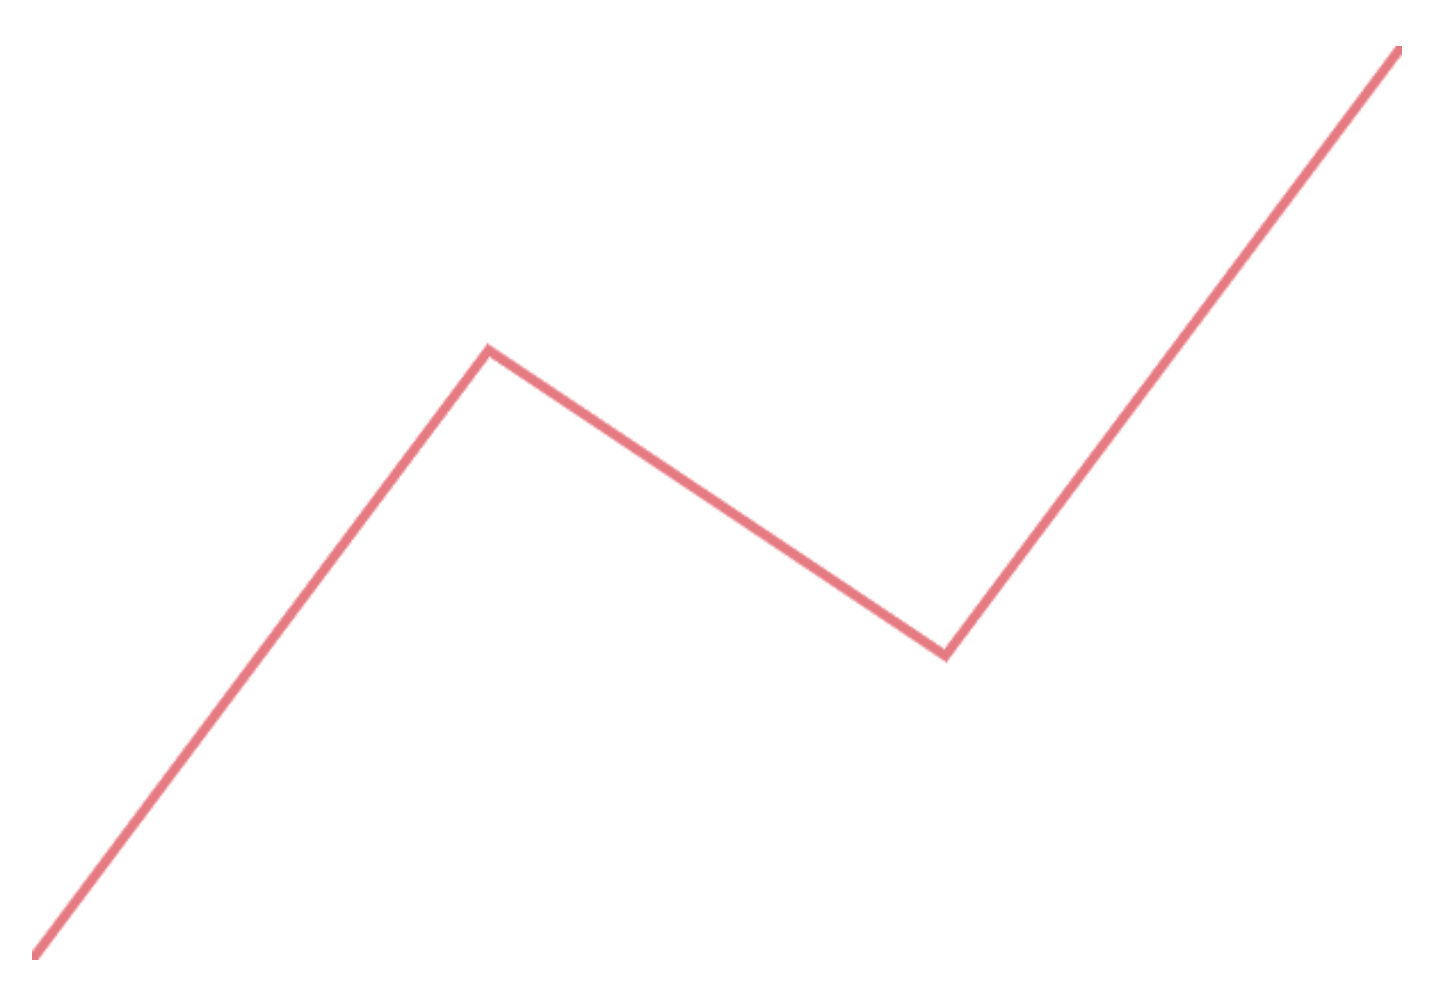
D3 also provides us with a line function, which is what Victory already uses under the hood. This function gives us more options for defining curves and steps.
function Line({ lineWidth, color, data, height, width }) {
  const canvasRef = React.useRef();

  const draw = React.useCallback(
    (ctx, data) => {
      const d3Line = d3
        .line()
        .x((d) => d.x)
        .y((d) => d.y)
        .curve(d3.curveNatural)
        .context(ctx);
      ctx.strokeStyle = color;
      ctx.lineWidth = lineWidth;

      d3Line(data);

      ctx.stroke();
    },
    [lineWidth, color]
  );

  React.useEffect(() => {
    const ctx = canvasRef.current.getContext("2d");
    draw(ctx, data);
  }, []);

  return (
    <canvas
      style={{ width: "100%" }}
      ref={canvasRef}
      height={height}
      width={width}
    />
  );
}

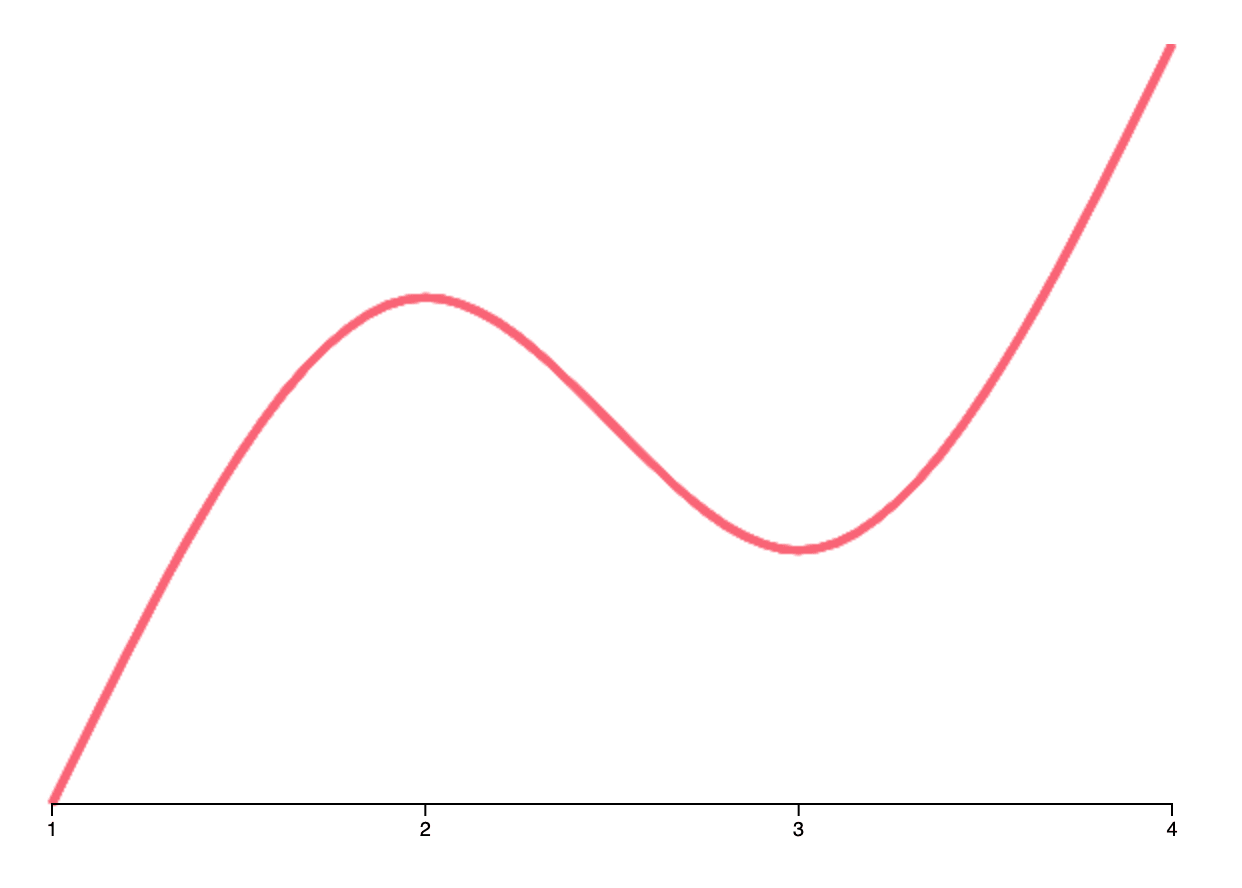
In order to use this component by itself, we need to do some work with D3 to define our scales. If you're unfamiliar with the concept of scaling data, this is basically the logic that translates x/y data to pixels in the canvas container.
function Chart() {
  const data = [
    { x: 1, y: 1 },
    { x: 2, y: 3 },
    { x: 3, y: 2 },
    { x: 4, y: 4 }
  ];

  const height = 400;
  const width = 600;

  const scaleX = d3.scaleLinear().domain([1, 4]).range([0, width]);
  const scaleY = d3.scaleLinear().domain([1, 4]).range([height, 0]);

  const scaledData = data.map(({ x, y }) => ({ x: scaleX(x), y: scaleY(y) }));

  return (
    <Container>
      <Line
        lineWidth={4}
        color="#F67280"
        data={scaledData}
        height={height}
        width={width}
      />
    </Container>
  );
}
Starting with 0,0 in the top left corner, scaledData in this example is equal to the coordinates of each point within the width and height of the canvas container.
//value of scaledData
[
  { x: 0, y: 400 },
  { x: 200, y: 133.33333333333334 },
  { x: 400, y: 266.6666666666667 },
  { x: 600, y: 0 }
];
Canvas + SVG
Using Canvas for data rendering doesn’t mean saying goodbye to SVG. Just like we can use layering to stack multiple canvas containers, we can also stack an SVG container for axes, tooltips, or other chart elements. This way we can cut down on rendering time without losing all the benefits of SVG.
Here is an example of how we might use D3's built-in SVG axis generator to create an x-axis for this chart.
function XAxis({ scale, height, margin }) {
  const axisRef = React.useRef();

  React.useEffect(() => {
    const axis = d3.select(axisRef.current);
    axis.select("g").remove();

    const axisGenerator = d3.axisBottom(scale).tickFormat((value) => value);
    const tickCount = 4;
    axisGenerator.ticks(tickCount);

    const group = axis.append("g");
    group.call(axisGenerator);
  }, [axisRef, scale]);

  return (
    <g ref={axisRef} transform={`translate(0, ${height - margin.bottom})`} />
  );
}

function Chart() {
  // Same as above

  return (
    <Container>
      <Line
        lineWidth={4}
        color="#F67280"
        data={scaledData}
        height={height}
        width={width}
      />
      <svg height={height} width={width} style={{ position: "absolute" }}>
        <XAxis scale={scaleX} height={height} margin={margin} />
      </svg>
    </Container>
  );
}
Building a Canvas Chart with Victory
In the examples above, I needed to do some manual work in order to scale my data, size my chart so it fits in the container, and add axes and labels. This would be especially true if I wanted to add animation or user interaction. This is where Victory is really helpful! Victory can do all this for me, while still allowing me to make all the decisions about how the data is rendered. In my mind, this is a great separation of concerns.
With very few modifications, we can plug this Canvas line into VictoryLine as the data component:
const height = 400;
const width = 600;

function Line({ data, style, scale }) {
  const canvasRef = React.useRef();
  const { stroke, strokeWidth } = style;

  const draw = React.useCallback(
    (ctx, data) => {
      const d3Line = d3
        .line()
        .x((d) => scale.x(d.x))
        .y((d) => scale.y(d.y))
        .curve(d3.curveNatural)
        .context(ctx);
      ctx.strokeStyle = stroke;
      ctx.lineWidth = strokeWidth;
      d3Line(data);
      ctx.stroke();
    },
    [stroke, strokeWidth, scale]
  );

  React.useEffect(() => {
    const ctx = canvasRef.current.getContext("2d");
    draw(ctx, data);
  });

  return (
    <foreignObject width={width} height={height} x={0} y={0}>
      <canvas ref={canvasRef} height={height} width={width} />
    </foreignObject>
  );
}

function Chart() {
  const data = [
    { x: 1, y: 1 },
    { x: 2, y: 3 },
    { x: 3, y: 2 },
    { x: 4, y: 4 }
  ];

  return (
    <VictoryLine
      data={data}
      style={{ data: { stroke: "#6C5B7B" } }}
      dataComponent={<Line />}
    />
  );
}
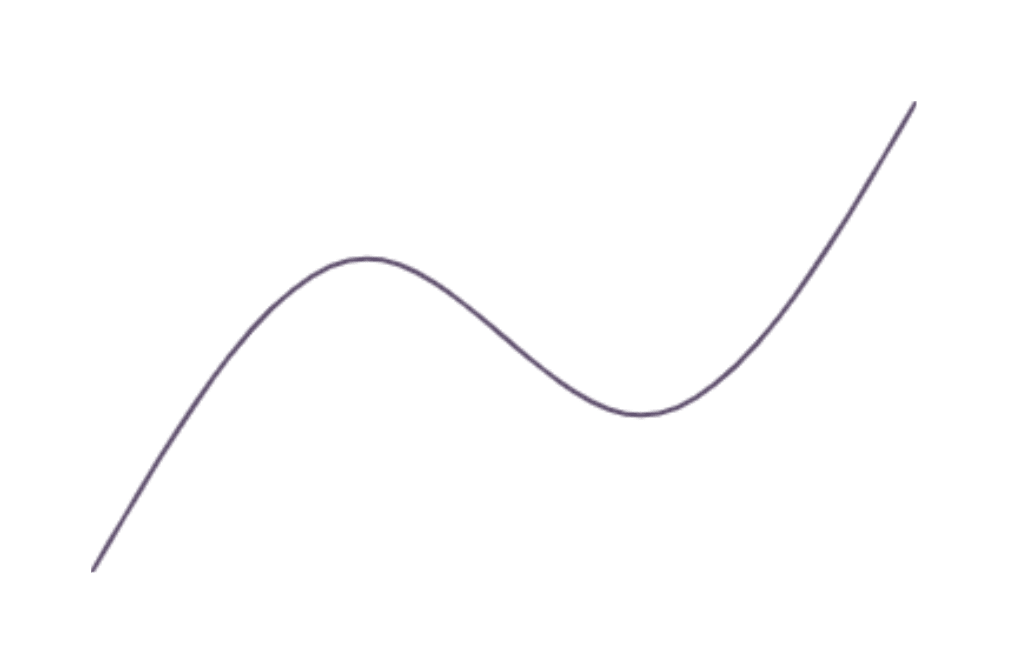
📝 If you’re unfamiliar with foreignObject, this is a way to plug a non-SVG component into an SVG container. This is the easiest way I have found to render the Canvas container along with the default SVG components and keep everything correctly sized.
We could also use the VictoryChart wrapper to provide default axes and tooltips:
function Chart() {
  const data = [
    { x: 1, y: 1 },
    { x: 2, y: 3 },
    { x: 3, y: 2 },
    { x: 4, y: 4 }
  ];

  return (
    <VictoryChart containerComponent={<VictoryVoronoiContainer />}>
      <VictoryLine
        labelComponent={<VictoryTooltip />}
        labels={({ datum }) => `${datum.x}, ${datum.y}`}
        data={data}
        style={{ data: { stroke: "#6C5B7B" } }}
        dataComponent={<Line />}
      />
    </VictoryChart>
  );
}

Victory Canvas
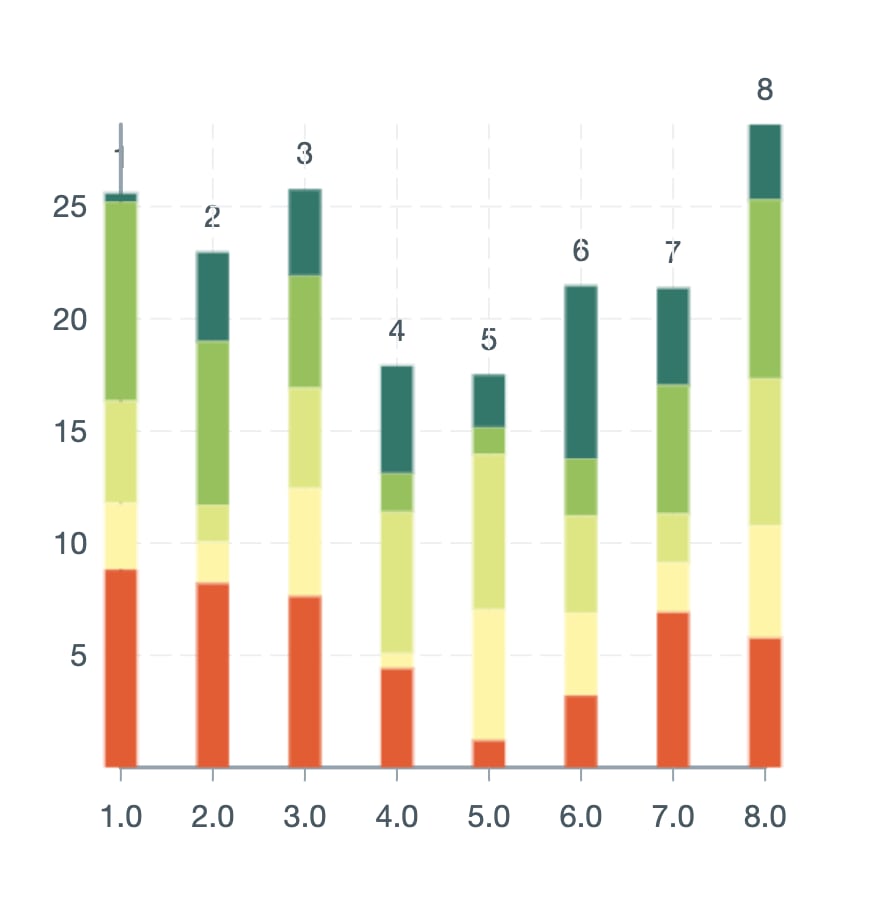
This was a simple example, but for components where we probably don’t want a separate canvas element for every single data point (like a scatter or bar chart), there is a little more work to be done. Victory 36.0.1 introduces an experimental victory-canvas package with some components to help with Canvas rendering. In the current implementation, a CanvasContainer component can be provided as the groupComponent prop, and the Canvas context will be available to child components via React context. This way, we can render line, scatter, and bar charts in Canvas with only a couple of additional imports:
import {
  VictoryChart,
  VictoryLine,
  VictoryVoronoiContainer,
  CanvasCurve,
  CanvasGroup
} from "victory";

function Chart() {
  const data = [
    { x: 1, y: 1 },
    { x: 2, y: 3 },
    { x: 3, y: 2 },
    { x: 4, y: 4 }
  ];

  return (
    <VictoryChart containerComponent={<VictoryVoronoiContainer />}>
      <VictoryLine
        data={data}
        style={{ data: { stroke: "#6C5B7B" } }}
        groupComponent={<CanvasGroup />}
        dataComponent={<CanvasCurve />}
      />
    </VictoryChart>
  );
}

Each Canvas component has feature parity with the corresponding Victory primitive component and can be used to create stacked charts, polar charts, or other custom visualizations.

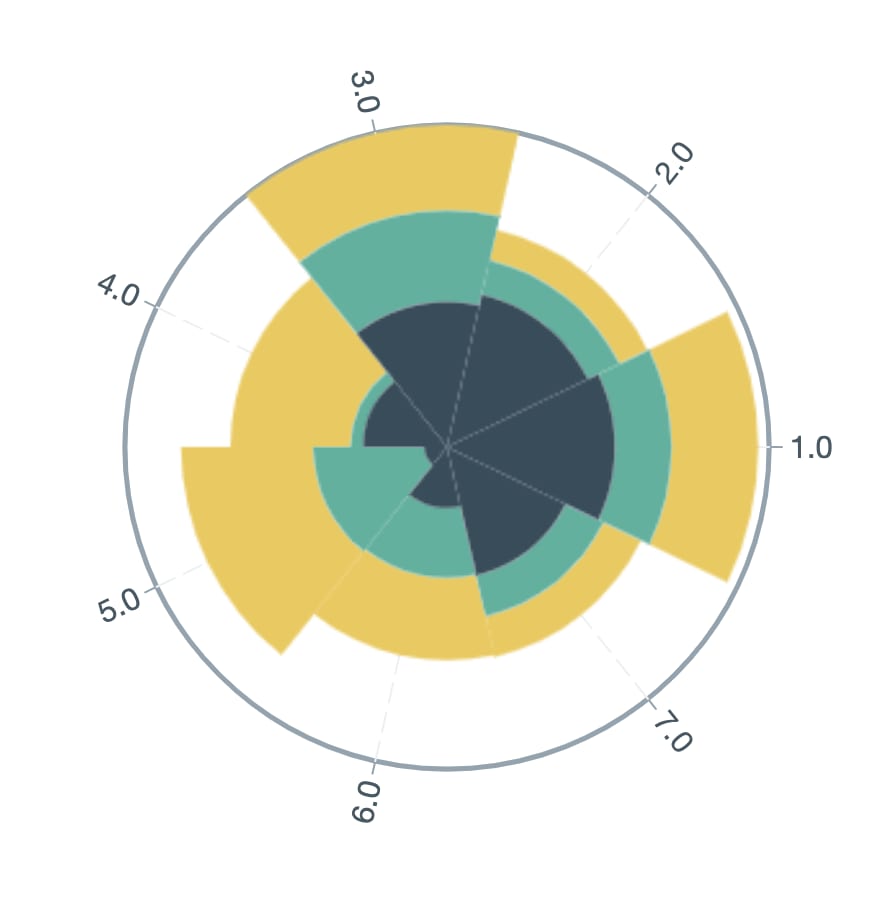
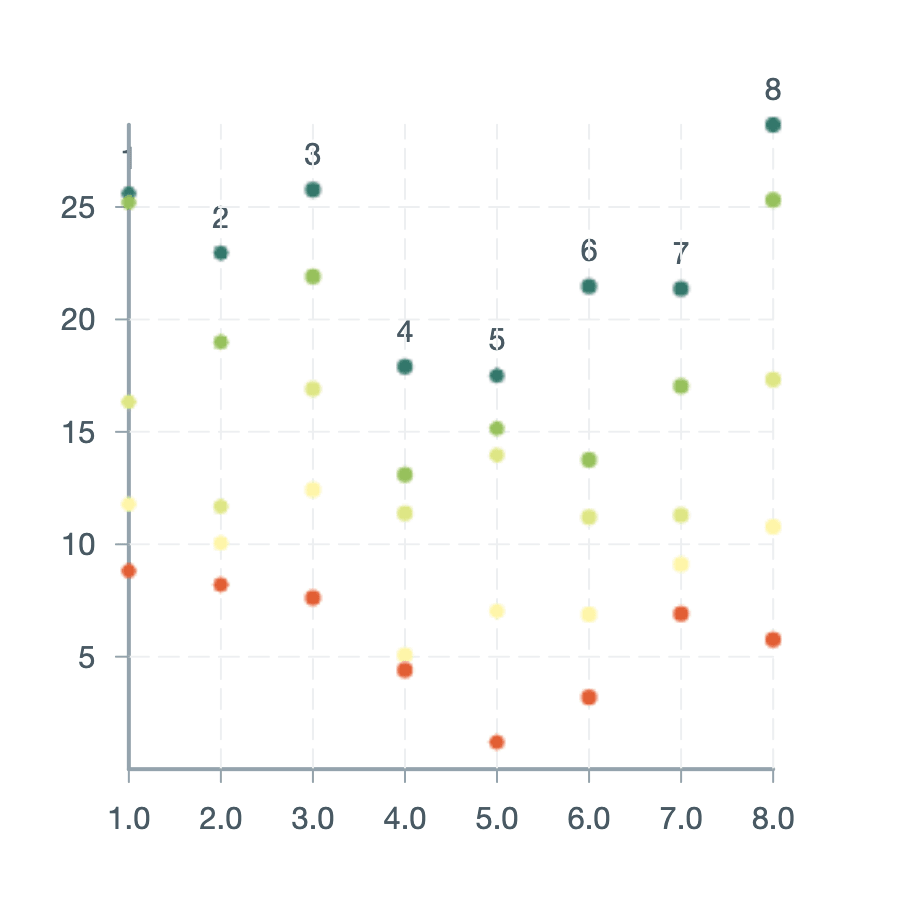
For more information, check out the documentation.
Conclusion
If you are looking for a more performant way to build a custom data visualization or render data in Victory, this is one of many options available to you. My one little caveat is this—Canvas components can be used to strategically cut down on rendering time in the main thread, but there is still a performance trade-off for some of Victory's developer-friendly conveniences. This post intentionally included examples with and without Victory, and for applications where performance is the top priority it may be worth evaluating whether a charting library is the right solution over custom D3 components.
Overall, I am excited about the future of Victory and look forward to sharing more ways to create beautiful and performant data visualizations. 📊
Resources:
Related Posts
Data Visualizations and the Main Thread: A (Sometimes) Love Story
 Becca Bailey
Introducing Renature: Experimenting with Physics for UI Animation
 Parker Ziegler