

Wouldn’t it be great if you could just push one button and start stepping through a Jest test script, line by line?
Writing test cases for the Jest testing framework is typically straightforward, but there can be exceptions. If Jest is being particularly persnickety with a test case you’ve written, the fastest path to getting to a solution is through debugging.
In this article, you’ll learn about setting up VS Code to debug your TypeScript Jest test cases. By the end, you’ll have a VS Code launch configuration that you can use in your projects time and time again.
Launch Configuration
Let’s start with what you’re after here: the launch configuration. Afterward, you’ll learn some fundamental properties that are being set and why.
Put this launch.json at the root of your project inside a folder named .vscode
{
  "version": "0.2.0",
  "configurations": [
    {
      "type": "node",
      "request": "launch",
      "name": "Test Spec File",
      "protocol": "inspector",
      "program": "${workspaceRoot}/node_modules/jest/bin/jest.js",
      "args": [
        "--collectCoverage=false",
        "--colors",
        "--config",
        "${workspaceRoot}/jest.config.js",
        "--runInBand",
        "--runTestsByPath",
        "${relativeFile}",
        "--testPathPattern=${fileDirname}",
        "--testTimeout=10000000"
      ],
      "outputCapture": "std",
      "internalConsoleOptions": "openOnSessionStart",
      "envFile": "${workspaceRoot}/.env",
      "skipFiles": [
        "${workspaceRoot}/../../node_modules/**/*",
        "<node_internals>/**/*"
      ],
      "windows": {
        "skipFiles": ["C:\\**\\node_modules\\**\\*", "<node_internals>/**/*"]
      },
      "disableOptimisticBPs": true
    }
  ]
}
This file is adapted from:
vscode-recipes/debugging-jest-tests at master · microsoft/vscode-recipes
⛔️ The example provided above however does not work well in a monorepo environment, especially with generic file naming conventions relying mostly on folder names (e.g. /src/services/orders/service.ts ) for structure.
⛔ If your
jestconfiguration is looking for files ending in a specific pattern such as*.spec.ts, the example provided above will not work because${fileBasenameNoExtension}does not (naturally) include the extension.
Program
The program property defines what is the entry point script for Node.js. To successfully debug a Jest test case, you must debug Jest itself. Thus, set program to the absolute location of the jest dependency in your project.
To do this, the replacement variable ${workspaceRoot} is used to identify the directory containing the jest dependency.
✔ You can use a mixture of Windows and POSIX-style paths here. For cross-platform compatibility, always use
/as the path separator, as Windows intrinsically handles a mixture of the two paths, while POSIX systems handle paths with only the/separator.
Args
The args property specifies the set of arguments passed to Node.js:
-
--collectCoverage=falseDuring debug, you want to turn off code coverage -
--colorsEnable colors -
--config ${workspaceRoot}/jest.config.jsSpecify the configuration forjest -
--runInBandEnsure test cases run in the current process; not a sub-process -
--runTestsByPath ${relativeFile}This, combined with--testPathPattern=${fileDirname}makes it possible to isolate a single test script -
--testTimeout=10000000Sets a much-longer timeout, allowing you to debug a test case withoutjestthrowing a timeout error
The real magic is the combination of --runTestsByPath ${relativeFile} and --testPathPattern=${fileDirname}
📝 Both
${relativeFile}and${fileDirname}are replacement variables you can use in your VS Code launch configuration.
📝
runTestsByPathtellsjestto run test cases that match the file named${relativeFile}— that is the relative path (from the currently open folder in VS Code) to the file having the current active focus in the VS Code editor!
📝
testPathPatterntellsjestto run test cases in the directory identified by${fileDirname}— that is the absolute directory of the same currently focused file.
The reason why you want to use both is to remove any ambiguity between two commonly named files in a monorepo project. By combining both the absolute directory and the relative path, you guarantee only the test cases in the script having the current active focus in VS Code are executed.
What makes this so powerful is that you simply put your cursor in the Jest test case you want to debug, ensure that the "Test Spec File" launch configuration is selected and press F5 to launch debug.
🚀 As an added bonus, this works on both Windows and POSIX systems.
testPathPatternaccepts both Windows and POSIX formats.
Output Capture
By default, VS Code does not send everything from stdout to the console. If your application executes console.log for example, it will not appear in the console.
While this seems wildly counterintuitive, simply set outputCapture to std to get past this.
Additional Options
You can also set the following additional options:
-
disableOptimisticBPsSuccessfully maps breakpoints to the code generated by the just-in-time transpilation of TypeScript to JavaScript -
envFileSpecify the.envfile to inject environment variables into the test cases -
skipFilesUseful to prevent the debugger from “falling into” internal Node.js code andnode_modulessource
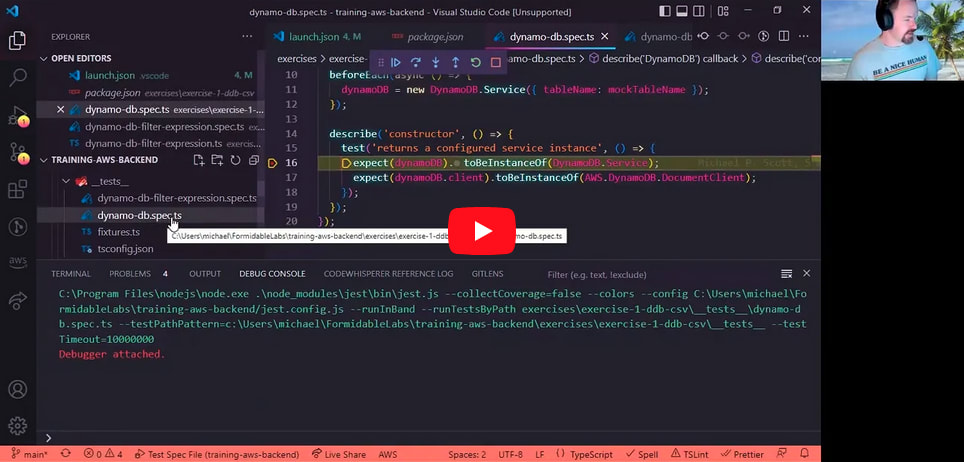
See it in Action
Whether you’re working in a mono- or a microrepo, writing and debugging jest test cases in VS Code can be a breeze.
- Setup your
launch.jsonfile - Put your cursor in the test script you want to debug
- Set some breakpoint(s)
- Press
F5
Here’s a walkthrough!
Related Posts
Implementing a Distributed Lock State Machine
Narrowing Types in TypeScript
 Trey Hoover
A Deep Dive into Debugging Cypress, iframes, & Runtime Code Modification
 Dillon Mulroy